W3cubDocs
/ReactNativeDebugging
Enabling Keyboard Shortcuts
React Native supports a few keyboard shortcuts in the iOS Simulator. They are described below. To enable them, open the Hardware menu, select Keyboard, and make sure that "Connect Hardware Keyboard" is checked.
Accessing the In-App Developer Menu
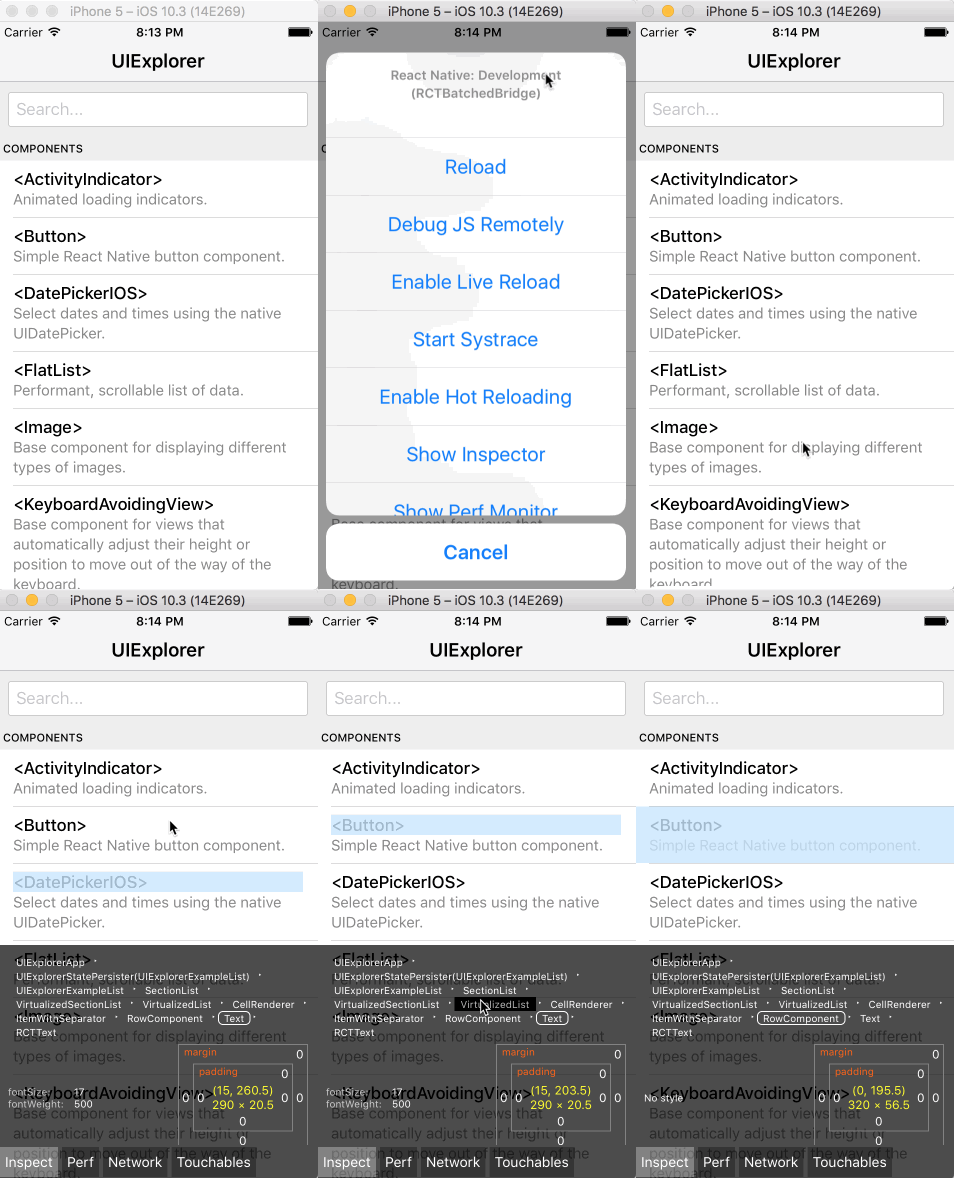
You can access the developer menu by shaking your device or by selecting "Shake Gesture" inside the Hardware menu in the iOS Simulator. You can also use the ⌘D keyboard shortcut when your app is running in the iOS Simulator, or ⌘M when running in an Android emulator on Mac OS and Ctrl+M on Windows and Linux. Alternatively for Android, you can run the command adb shell input keyevent 82 to open the dev menu (82 being the Menu key code).
The Developer Menu is disabled in release (production) builds.
Reloading JavaScript
Instead of recompiling your app every time you make a change, you can reload your app's JavaScript code instantly. To do so, select "Reload" from the Developer Menu. You can also press ⌘R in the iOS Simulator, or tap R twice on Android emulators.
Automatic reloading
You can speed up your development times by having your app reload automatically any time your code changes. Automatic reloading can be enabled by selecting "Enable Live Reload" from the Developer Menu.
You may even go a step further and keep your app running as new versions of your files are injected into the JavaScript bundle automatically by enabling Hot Reloading from the Developer Menu. This will allow you to persist the app's state through reloads.
There are some instances where hot reloading cannot be implemented perfectly. If you run into any issues, use a full reload to reset your app.
You will need to rebuild your app for changes to take effect in certain situations:
- You have added new resources to your native app's bundle, such as an image in
Images.xcassetson iOS or theres/drawablefolder on Android. - You have modified native code (Objective-C/Swift on iOS or Java/C++ on Android).
In-app Errors and Warnings
Errors and warnings are displayed inside your app in development builds.
Errors
In-app errors are displayed in a full screen alert with a red background inside your app. This screen is known as a RedBox. You can use console.error() to manually trigger one.
Warnings
Warnings will be displayed on screen with a yellow background. These alerts are known as YellowBoxes. Click on the alerts to show more information or to dismiss them.
As with a RedBox, you can use console.warn() to trigger a YellowBox.
YellowBoxes can be disabled during development by using console.disableYellowBox = true;. Specific warnings can be ignored programmatically by setting an array of prefixes that should be ignored:
import {YellowBox} from 'react-native';
YellowBox.ignoreWarnings(['Warning: ...']);
In CI/Xcode, YellowBoxes can also be disabled by setting the IS_TESTING environment variable.
RedBoxes and YellowBoxes are automatically disabled in release (production) builds.
Chrome Developer Tools
To debug the JavaScript code in Chrome, select "Debug JS Remotely" from the Developer Menu. This will open a new tab at http://localhost:8081/debugger-ui.
Select Tools → Developer Tools from the Chrome Menu to open the Developer Tools. You may also access the DevTools using keyboard shortcuts (⌘⌥I on macOS, Ctrl Shift I on Windows). You may also want to enable Pause On Caught Exceptions for a better debugging experience.
Note: the React Developer Tools Chrome extension does not work with React Native, but you can use its standalone version instead. Read this section to learn how.
Debugging using a custom JavaScript debugger
To use a custom JavaScript debugger in place of Chrome Developer Tools, set the REACT_DEBUGGER environment variable to a command that will start your custom debugger. You can then select "Debug JS Remotely" from the Developer Menu to start debugging.
The debugger will receive a list of all project roots, separated by a space. For example, if you set REACT_DEBUGGER="node /path/to/launchDebugger.js --port 2345 --type ReactNative", then the command node /path/to/launchDebugger.js --port 2345 --type ReactNative /path/to/reactNative/app will be used to start your debugger.
Custom debugger commands executed this way should be short-lived processes, and they shouldn't produce more than 200 kilobytes of output.
React Developer Tools
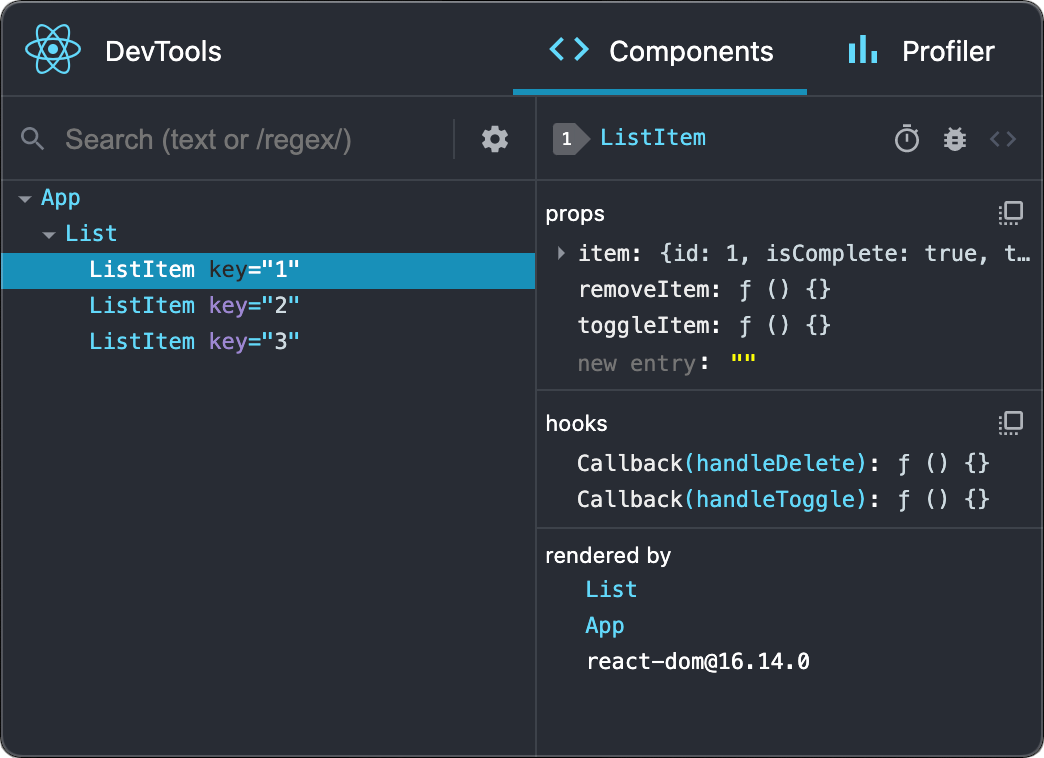
You can use the standalone version of React Developer Tools to debug the React component hierarchy. To use it, install the react-devtools package globally:
npm install -g react-devtools
Now run react-devtools from the terminal to launch the standalone DevTools app:
react-devtools

It should connect to your simulator within a few seconds.
Note: if you prefer to avoid global installations, you can add
react-devtoolsas a project dependency. Add thereact-devtoolspackage to your project usingnpm install --save-dev react-devtools, then add"react-devtools": "react-devtools"to thescriptssection in yourpackage.json, and then runnpm run react-devtoolsfrom your project folder to open the DevTools.
Integration with React Native Inspector
Open the in-app developer menu and choose "Show Inspector". It will bring up an overlay that lets you tap on any UI element and see information about it:

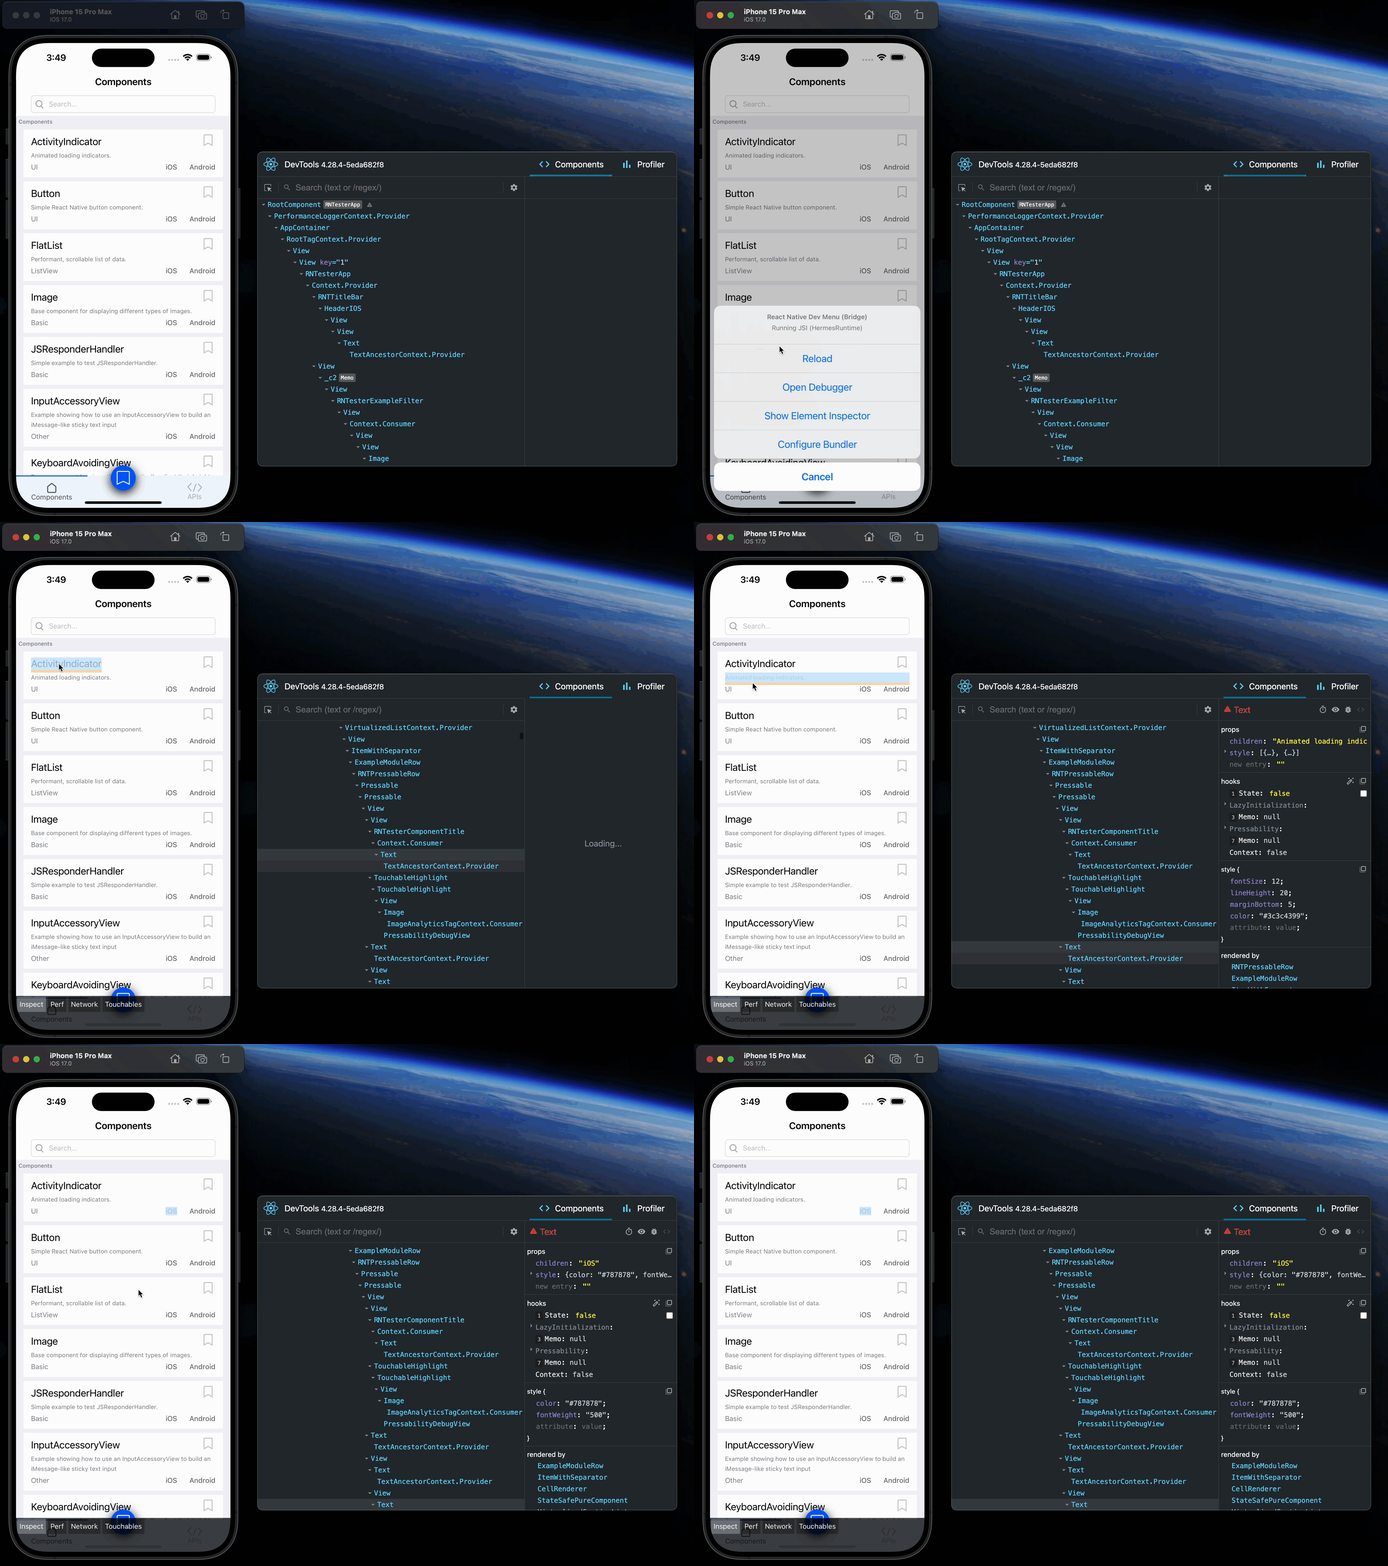
However, when react-devtools is running, Inspector will enter a special collapsed mode, and instead use the DevTools as primary UI. In this mode, clicking on something in the simulator will bring up the relevant components in the DevTools:

You can choose "Hide Inspector" in the same menu to exit this mode.
Inspecting Component Instances
When debugging JavaScript in Chrome, you can inspect the props and state of the React components in the browser console.
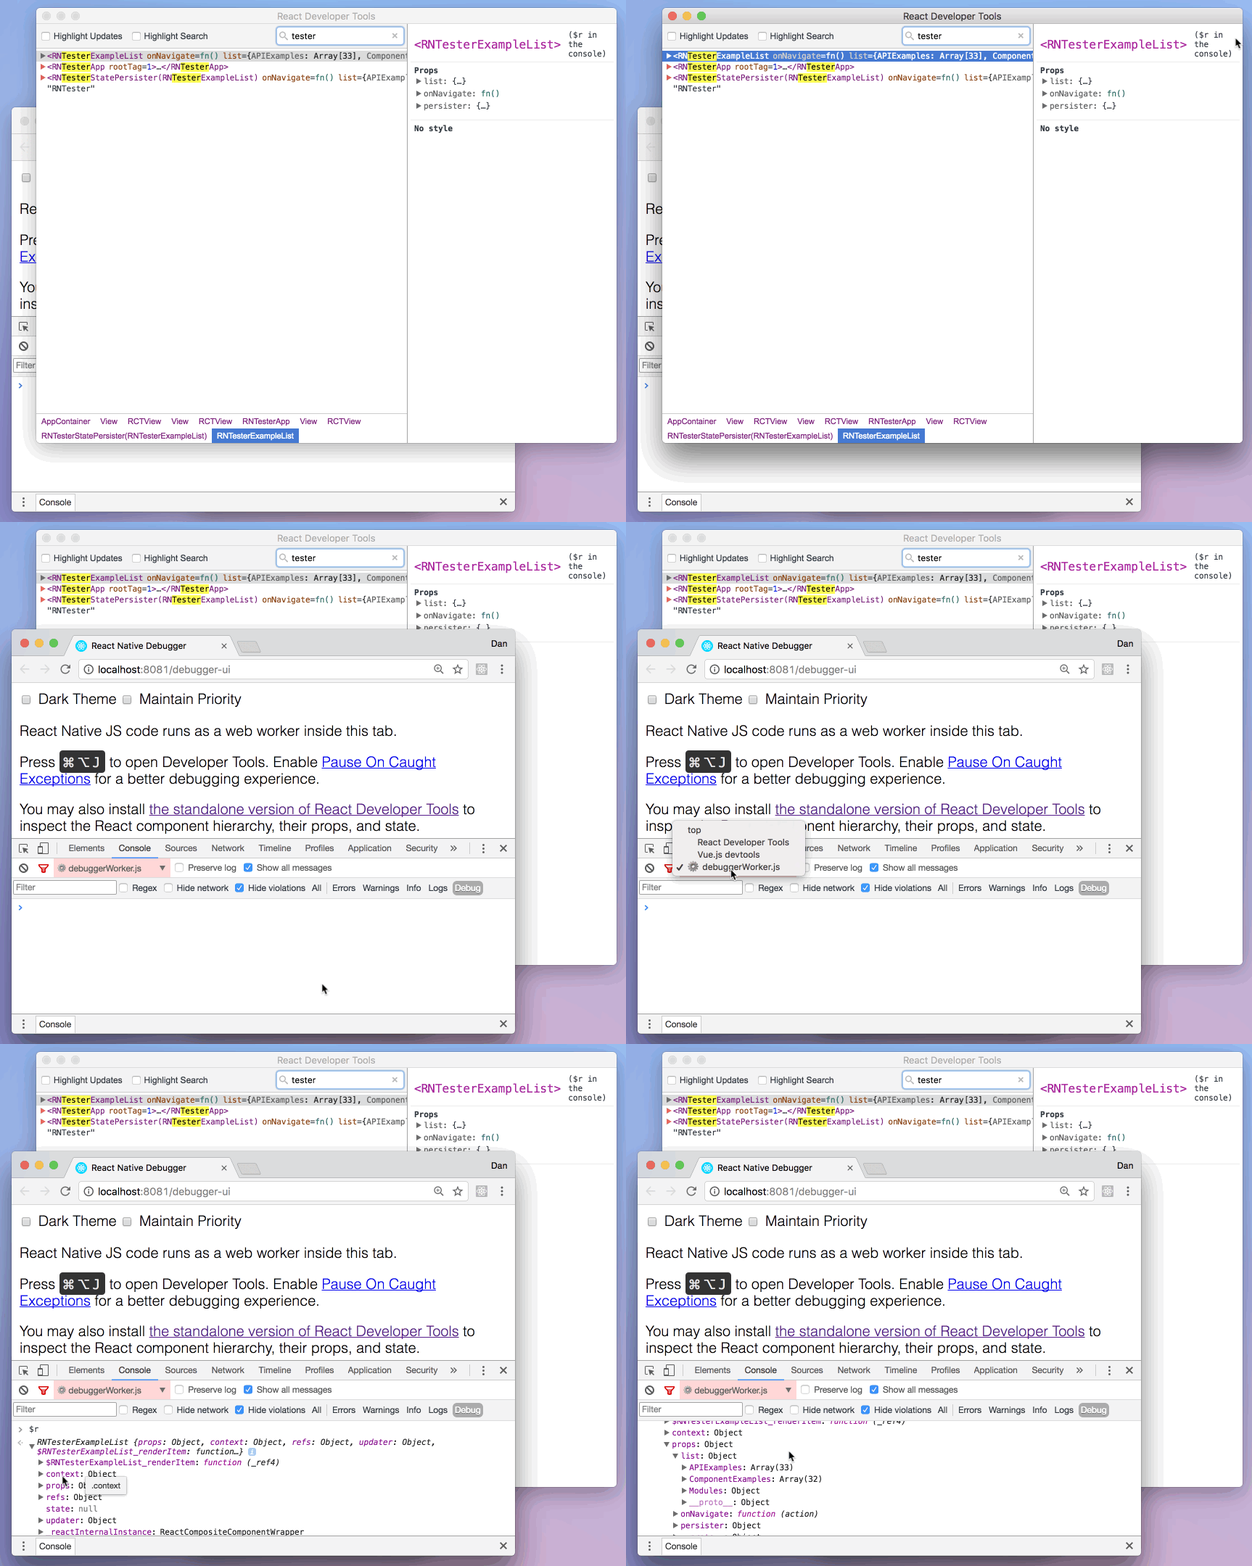
First, follow the instructions for debugging in Chrome to open the Chrome console.
Make sure that the dropdown in the top left corner of the Chrome console says debuggerWorker.js. This step is essential.
Then select a React component in React DevTools. There is a search box at the top that helps you find one by name. As soon as you select it, it will be available as $r in the Chrome console, letting you inspect its props, state, and instance properties.

Performance Monitor
You can enable a performance overlay to help you debug performance problems by selecting "Perf Monitor" in the Developer Menu.
Debugging in Ejected Apps
Accessing console logs
You can display the console logs for an iOS or Android app by using the following commands in a terminal while the app is running:
$ react-native log-ios
$ react-native log-android
You may also access these through Debug → Open System Log... in the iOS Simulator or by running adb logcat *:S ReactNative:V ReactNativeJS:V in a terminal while an Android app is running on a device or emulator.
If you're using Create React Native App, console logs already appear in the same terminal output as the packager.
Debugging on a device with Chrome Developer Tools
If you're using Create React Native App, this is configured for you already.
On iOS devices, open the file RCTWebSocketExecutor.m and change "localhost" to the IP address of your computer, then select "Debug JS Remotely" from the Developer Menu.
On Android 5.0+ devices connected via USB, you can use the adb command line tool to setup port forwarding from the device to your computer:
adb reverse tcp:8081 tcp:8081
Alternatively, select "Dev Settings" from the Developer Menu, then update the "Debug server host for device" setting to match the IP address of your computer.
If you run into any issues, it may be possible that one of your Chrome extensions is interacting in unexpected ways with the debugger. Try disabling all of your extensions and re-enabling them one-by-one until you find the problematic extension.
Debugging with Stetho on Android
Follow this guide to enable Stetho for Debug mode:
-
In
android/app/build.gradle, add these lines in thedependenciessection:debugCompile 'com.facebook.stetho:stetho:1.5.0' debugCompile 'com.facebook.stetho:stetho-okhttp3:1.5.0'
The above will configure Stetho v1.5.0. You can check at http://facebook.github.io/stetho/ if a newer version is available.
-
Create the following Java classes to wrap the Stetho call, one for release and one for debug:
// android/app/src/release/java/com/{yourAppName}/StethoWrapper.java

public class StethoWrapper {

    public static void initialize(Context context) {
        // NO_OP
    }

    public static void addInterceptor() {
        // NO_OP
    }
}
// android/app/src/debug/java/com/{yourAppName}/StethoWrapper.java public class StethoWrapper { public static void initialize(Context context) { Stetho.initializeWithDefaults(context); } public static void addInterceptor() { OkHttpClient client = OkHttpClientProvider.getOkHttpClient() .newBuilder() .addNetworkInterceptor(new StethoInterceptor()) .build(); OkHttpClientProvider.replaceOkHttpClient(client); } } Open
android/app/src/main/java/com/{yourAppName}/MainApplication.javaand replace the originalonCreatefunction:
  public void onCreate() {
      super.onCreate();

      if (BuildConfig.DEBUG) {
          StethoWrapper.initialize(this);
          StethoWrapper.addInterceptor();
      }

      SoLoader.init(this, /* native exopackage */ false);
    }
Open the project in Android Studio and resolve any dependency issues. The IDE should guide you through this steps after hovering your pointer over the red lines.
Run
react-native run-android.In a new Chrome tab, open:
chrome://inspect, then click on the 'Inspect device' item next to "Powered by Stetho".
Debugging native code
When working with native code, such as when writing native modules, you can launch the app from Android Studio or Xcode and take advantage of the native debugging features (setting up breakpoints, etc.) as you would in case of building a standard native app.
© 2015–2018 Facebook Inc.
Licensed under the Creative Commons Attribution 4.0 International Public License.
https://facebook.github.io/react-native/docs/debugging